Application Flows - Detailed flows list
The Detailed flows list shows a table with each active flow displayed on a separate line. A flow becomes active and is displayed in the window as soon as a packet belonging to it is detected during the session.
You can toggle between this view and the flows map with the ![]() /
/ ![]() button.
Both views are different representations of the same data, with the same filters applied.
button.
Both views are different representations of the same data, with the same filters applied.
Flows - Application flows:
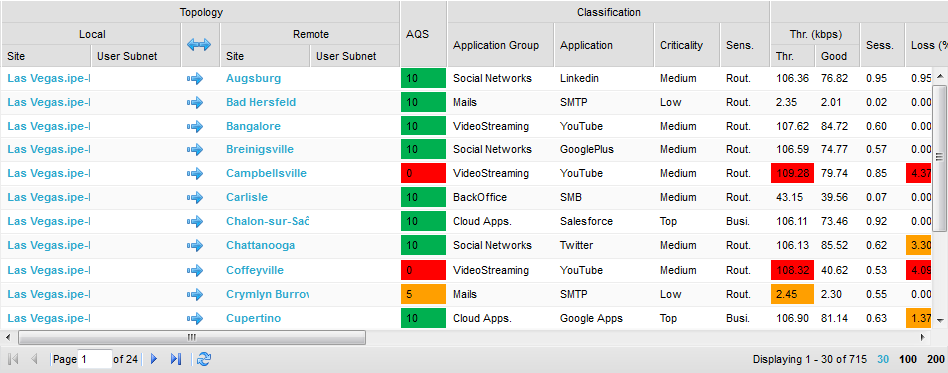
The table contains the following columns:
|
Topology |
||||||||||
|
Local Site |
name of the selected Appliance |
|||||||||
|
Local User Subnet |
name of the User subnet on the local Site (this field is empty if the local IP address does not belong to any User subnet defined on the Site) |
|||||||||
|
|
direction of the flow: |
|||||||||
|
Remote Site |
name of the remote Appliance (where the flow is going to or coming from) |
|||||||||
|
Remote User Subnet |
name of the remote User subnet |
|||||||||
|
|
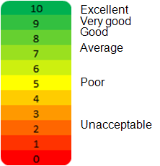
Application Quality Score of the flow: score between 0 (extremely bad quality) and 10 (excellent quality), displayed with two decimals. The color of the field also represents the quality, with the following meaning:
Note: Note: Excellent, Very good, etc., are only a typical interpretation of the AQS with typical parameters. It may vary according to the users' sensibility and according to the QoS profile parameters. When the AQS is not good, the parameters (delay, jitter, loss, etc.) that triggered an average or a bad quality score are also highlighted with the same color, so that you can easily find which parameters objectives were not met (yellow) or which parameters maximum values were exceeded (red). 100 is a reserved value used when the AQS cannot be computed. The quality of a flow cannot be computed when all the three following conditions are met:
|
|||||||||
|
Classification |
||||||||||
|
Application Group |
name of the Application Group where the flow is classified |
|||||||||
|
Application |
name of the application |
|||||||||
|
Criticality |
criticality level of the flow (Top, High, Medium or Low) |
|||||||||
|
LAN |
||||||||||
|
Thr. (kbps) |
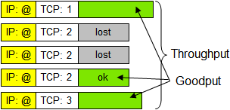
LAN throughput (number of bits per second sent at the IP layer level) Good: LAN goodput (number of useful bits received at the application layer i.e. payload of the TCP and UDP packets received on the downstream side; retransmitted, out of sequence and lost packets are not counted). Throughput vs Goodput, example:
|
|||||||||
|
Sess. |
number of sessions, represented by the average activity for the duration of the Correlation Record (by default: T = 1 minute). For example, 1 session running during T plus 1 session running during half this period of time will give 1 + 0.5 = 1.5 session. A session is identified by the following parameters:
|
|||||||||
|
Loss (%) |
LAN loss rate (measured between the LAN port of the source Appliance and the LAN port of the destination Appliance) |
|||||||||
|
Delay (ms) |
LAN one-way-delay (in ms) measured between the LAN port of the source Appliance and the LAN port of the destination Appliance
|
|||||||||
|
Jitter (ms) |
LAN jitter (delay variation measured between the LAN port of the source Appliance and the LAN port of the destination Appliance) |
|||||||||
|
WAN |
||||||||||
|
Thr. (kbps) |
WAN throughput (number of bits per second sent at the IP layer level) |
|||||||||
|
Loss (%) |
WAN loss rate (measured between the WAN port of the source Appliance and the WAN port of the destination Appliance) |
|||||||||
|
Delay (ms) |
WAN one-way-delay (in ms) measured between the WAN port of the source Appliance and the WAN port of the destination Appliance
|
|||||||||
|
Jitter (ms) |
WAN jitter (delay variation measured between the WAN port of the source Appliance and the WAN port of the destination Appliance) |
|||||||||
|
Comp |
||||||||||
|
Ratio |
compression ratio for the flow (when applicable) |
|||||||||
|
TCP |
||||||||||
|
SRT (ms) |
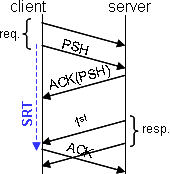
The Server Response Time measures the delay (in ms) between the last packet sent by the client during a request (PSH) and the emission of the acknowledgement to the first packet received from the server (ACK). When an Appliance is installed on the client side, it measures this response time and reports it to SALSA domain configuration server; otherwise, it is the Appliance installed on the server side that does it (and the measurement is made between the reception of the PSH and the reception of the ACK). If the same Appliance does not see the two ways of the TCP connection (in case of a cluster with asymmetric routing), the SRT will not be measured unless the two Appliances of the cluster are connected together and the ASR feature is configured.
|
|||||||||
|
RTT (ms) |
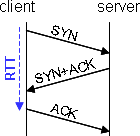
The Round Trip Time measures the time of establishment of a TCP connection (3-way handshake: SYN, SYN+ACK, ACK), i.e the delay (in ms) between the emission of the SYN and the emission of the ACK. When an Appliance is installed on the client side, it measures this RTT and reports it to SALSA domain configuration server; otherwise, it is the Appliance installed on the server side that does it (and the measurement is made between the reception of the SYN and the reception of the ACK). If the same Appliance does not see the two ways of the TCP connection (in case of a cluster with asymmetric routing), the RTT will not be measured unless the two Appliances of the cluster are connected together and the ASR feature is configured.
|
|||||||||
|
Ret. (%) |
percentage of TCP retransmissions |
|||||||||
|
Comp. |
compression status: Yes if the flow is compressed, No otherwise |
|||||||||
|
Accu. |
accuracy of the current measurement: High if the flow is qualified, Low otherwise |
|||||||||
|
Al. |
this field indicates, when at 'yes', the presence of an alarm on the Appliance. Check its status for further information. In case of alarm, the correlation records are ignored. |
|||||||||
|
TOS / DSCP |
||||||||||
|
|
name of the TOS / DSCP value used to recognize the application, when applicable |
This table is refreshed about every minute (according to the Appliance collect period option).
