Activity Summary
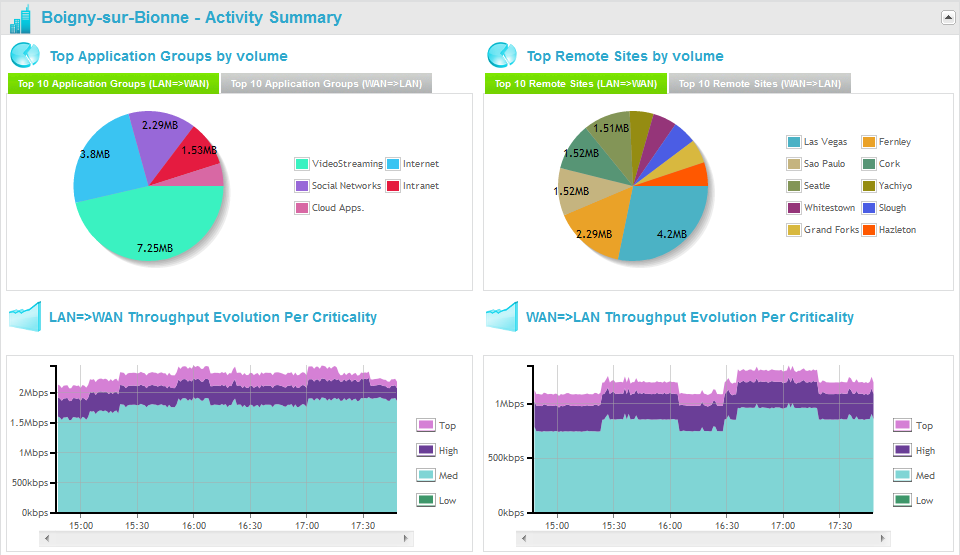
This frame shows four graphs with the following information:

![]() Top Application Groups
by volume
Top Application Groups
by volume
This pie chart shows the top 10 AGs, with their names and volumes:
| • | top 10 in volume of outgoing traffic (Top 10 Application Groups (LAN => WAN) tab), |
| • | top 10 in volume of incoming traffic (Top 10 Application Groups (WAN => LAN) tab), |
Clicking on an AG in the chart automatically filters the traffic for that AG in the Application Flows frame below.
![]() Top Remote Sites by
volume
Top Remote Sites by
volume
Note: This pie chart is available if and only if history has been enabled for the application flows (Per minute application flows lifetime parameter in SALSA platform configuration's Domain window, e.g. 72, 72, 0, 0).
This pie chart shows the top 10 Remote Sites, with their names and volumes:
| • | top 10 in volume of traffic sent to these Sites (Top 10 Remote Sites (LAN => WAN) tab), |
| • | top 10 in volume of traffic received from these Sites (Top 10 Remote Sites (WAN => LAN) tab), |
![]() LAN => WAN Throughput
Evolution Per Criticality
LAN => WAN Throughput
Evolution Per Criticality
This historical graph shows the evolution of the WAN throughput of the outgoing traffic, by criticality level (Top/High/Medium/Low).
![]() WAN => LAN Throughput
Evolution Per Criticality
WAN => LAN Throughput
Evolution Per Criticality
This historical graph shows the evolution of the WAN throughput of the incoming traffic, by criticality level (Top/High/Medium/Low).