Sites
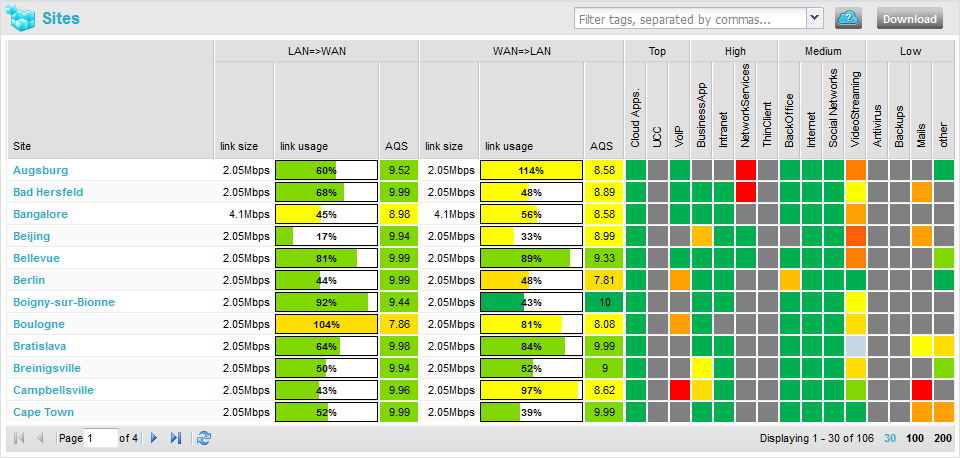
This frame shows, for all the Sites, the following information:
|
•
|
Site: name of the Site; by clicking on that name, a new window opens
with more details on the selected Site. |
|
•
|
The Sites' links usage and quality with, for each direction (LAN =>
WAN and WAN => LAN), the following fields: |
|
•
|
link size: WAN access throughput (max BW), |
|
•
|
link usage: usage of the link, displayed both as a percentage of the
link size and as a bar, the size of which is proportional to the usage, |
|
•
|
AQS: quality of the link, displayed both as an AQS value (between 0
and 10) and as a color (between green (AQS = 10) and red (AQS = 0)). |
|
•
|
The Sites' Application Groups volume and quality, sorted by Criticality
levels (Top, High, Medium, Low), with each cell color representing the
quality of the corresponding Application Group (in the same column) for the
corresponding link (on the same line); it can take any hue between green (AQS
= 10) and red (AQS = 0). |
|
•
|
you can read the exact values by hovering your mouse on the cells; |
|
•
|
clicking on a cell opens a new window for the corresponding Site,
where it filters the flows in the Site's Real Time Flows list
according to the selected Application Group: thanks to this feature, you
can immediately access the details of any Application Group for any Site; |
|
•
|
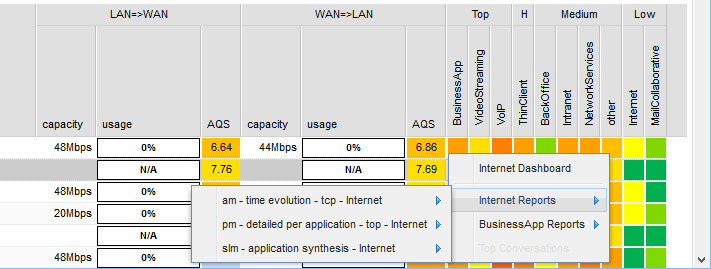
right-clicking a cell displays a contextual menu which enables you to display reports for the Application Group and for the corresponding Site, as illustrated below: |

This view is automatically refreshed every minute (or every 5 or 15
minutes).

