Checking Active Alarms
You can access this dashboard by
| • | selecting the Supervision -> Active Alarms function from the SD-WAN Orchestrator main menu, |
| • | drilling down on any colored alarm counter in the Overview dashboard, |
| • | clicking the  button in the top right corner of the Event History dashboard. Navigating between the Active Alarms and Event History dashboards enables you to keep the defined time range and filters, button in the top right corner of the Event History dashboard. Navigating between the Active Alarms and Event History dashboards enables you to keep the defined time range and filters, |
| • | clicking the Notification counter  in the SD-WAN Orchestrator main menu. in the SD-WAN Orchestrator main menu. |

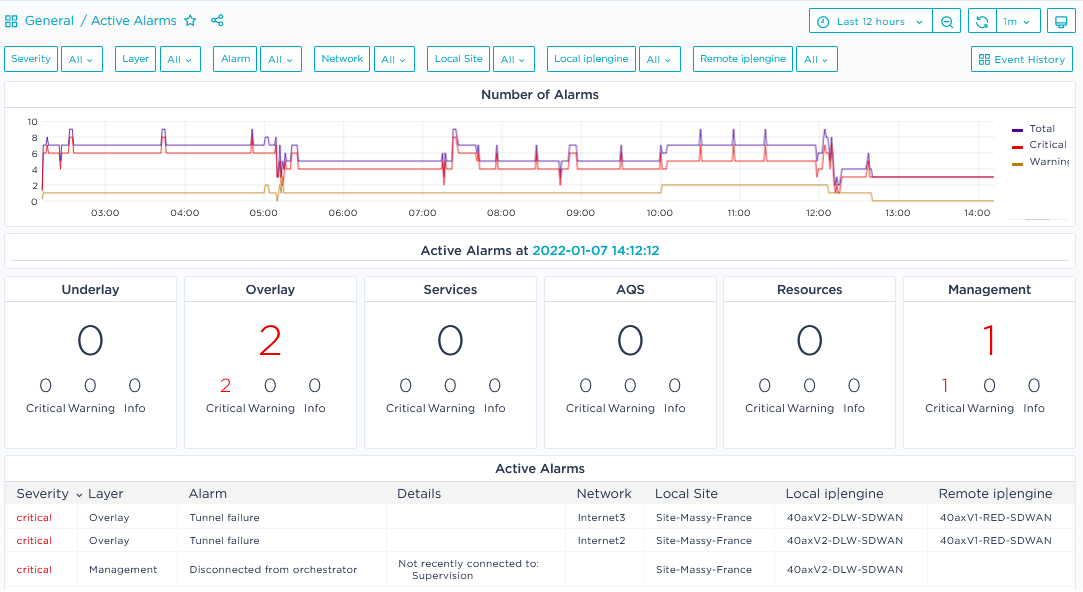
This dashboard displays the active Critical, Warning and Information alarms, i.e. their status is still 'raised' at the time specified on the second pane (Active Alarms at). This time also corresponds to the last point at the right end of the graph. You may filter these alarms by:
| • | severity |
| • | layer |
| • | Underlay: physical connection between devices (LAN, WAN), VRRP or HA state change, ip|engine configuration |
| • | Overlay: connection between ip|engines or external gateways through IPsec tunnels |
| • | Services: services provided with the ip|engines such as application visibility, application control, WAN optimization, firewall |
| • | AQS: site AQS for applications and site connectivity |
| • | Resources: device local resources, i.e. hardware monitoring |
| • | Management: connection to Azure components (Orchestrator, ZTP Server, etc.) |
| • | alarm |
| • | network |
| • | local site |
| • | local ip|engine: first ip|engine in the case of tunnel failure or end-to-end connectivity lost issue |
| • | remote ip|engine: second ip|engine in the case of tunnel failure or end-to-end connectivity lost issue |
The Alarm Filter stack of values only contains the alarms that have already been raised (not all the system alarms).
The severity of alarms is specified by the following colors: red for Critical, orange for Warning and green for Information.
The filters you select at the top of the dashboard apply to all three panes and to the Event History dashboard when you call it from the top button.
The last dashboard pane lists the active alarms with the network objects they apply to.
Selecting the Display Criteria
From the button toolbar located in the top right corner of the dashboard, click the Time Range button. It specifies the current time range.

You can modify the default time range by applying an Absolute Time Range you have defined, or by selecting a Relative Time Range from the list.
The dashboard default time zone (local browser time) is displayed in orange. You can modify this value by selecting Change time settings in the Time Range selector.
If you want your dashboard to be refreshed automatically, select a period from the Refreshing stack: 
Instead of defining an automatic refresh period, you can refresh the dashboard manually by hitting the  button.
Zooming Out
Click the  button in the top right button toolbar to zoom out dashboard display. The time range is extended as specified at the top of the window: .

You can use the arrows on both sides of the time range to move forward and backward (one time range shifts).
Zooming In
Zoom in on the time series graph by positioning your cursor on a specific section of the graph and dragging to the right. The result graph displays more points at a lower display rate. You can continue zooming in until you reach the necessary detailed report.


On any time series graph, you may display the evolution curve of each type of alarm separately by selecting the alarm category in the graph legend. The image below only displays Critical alarms. To go back to Total display, subsequently click all the categories while holding down the CTRL key of your keyboard.

Using Dashboard Cell functions
Click the title of any cell/pane in the dashboard to display the functional menu. The available functions depend on the type of presentation (time series graph, table, etc.).

| • | Use the View function to fully display this dashboard cell. |
| • | Use the Share function to link, embed or take a snapshot of this dashboard cell. |
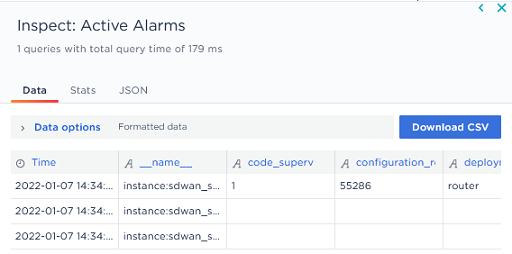
| • | Use the Inspect -> Data function to export the cell data as a .csv file, display statistics and JSON panels, etc. |

Click Download CSV, then open the file in MS Excel and save it.
| • | Use the More -> Toggle legend function to hide/display the legend when the cell contains a graph. You can also click legend elements for exclusive display. |
Sorting Table columns
On a table, you may sort column data by clicking the column header names.