Connection
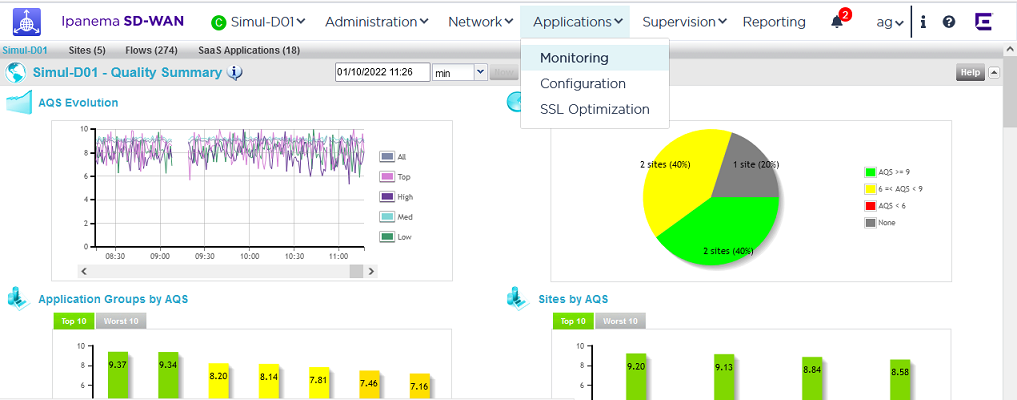
From the SD-WAN Orchestrator main menu, select Applications -> Monitoring.
The Application Monitoring dashboard window
is made of two parts:
From the View bar, you can select the following views:
|
•
|
<Customer_name>: displays
Client-level information |
|
•
|
Sites (<number>): shows the list
of Sites with their usage and quality |
|
•
|
Flows (<number>): shows the list
of flows at the Client level |
|
•
|
SaaS Applications (<number>): shows the list
of SaaS Applications at the Client level |
|
•
|
<Site_name> (only displayed when
you click on a Site name or graph in one of the previous views): enables you to see more details for the selected Site; several Site views can be open
simultaneously. You can close a Site
view by clicking on the white cross next to its name:  . . |
The main space shows the different views:
 <Customer> - Quality Summary
 <Customer> - Activity Summary
 <Customer> - WANs and Applications
|
•
|
Sites (<number>) with two frames (<number> is the number of Sites currently
configured): |
 Overview
 Sites
Sites
|
•
|
Flows (<number>) with two frames (<number> is the number of Flows measured
during the last polling period): |
 Overview
 Application flows
|
•
|
<Site_name>, with up to six frames, depending on the User rights: |
 <Site> - Quality Summary
 <Site> - Activity Summary
 <Site> - Throughput Summary per NAP
 <Site> - WANs and Applications
 <Site> - Application flows
 <Site> - Discovery
 SaaS Applications over the last Hours

![]() <Customer> - WANs and Applications
<Customer> - WANs and Applications![]() <Site> - Throughput Summary per NAP
<Site> - Throughput Summary per NAP![]() <Site> - WANs and Applications
<Site> - WANs and Applications